No wonder the past few days have been alarming for many. On Monday, the Dow fell 1,000 points in the morning — its largest point swing ever.
But most Americans aren’t day traders. They are in the stock market for the right reason — because they want to grow their money over many years or decades.
The smartest move in the past few days was to not panic and dump stocks. Here are 5 simple charts to get some perspective on where investors are at after these wild swings.
If you want to understand more about these topics, go to the link at the bottom of this article for the CNN Money original article.
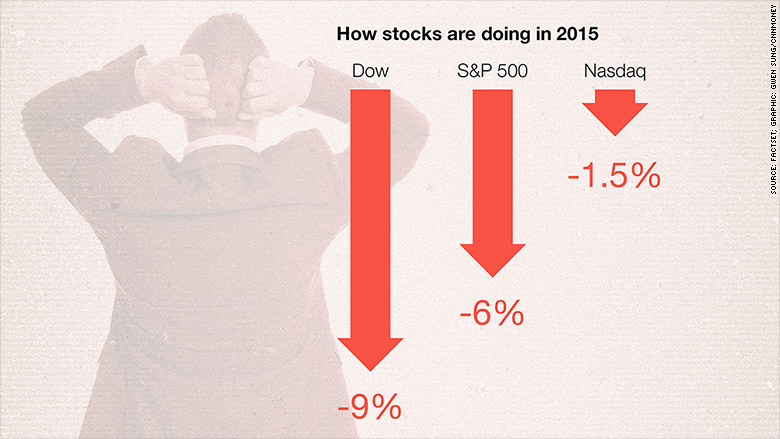
1. Your stocks are losing money in 2015
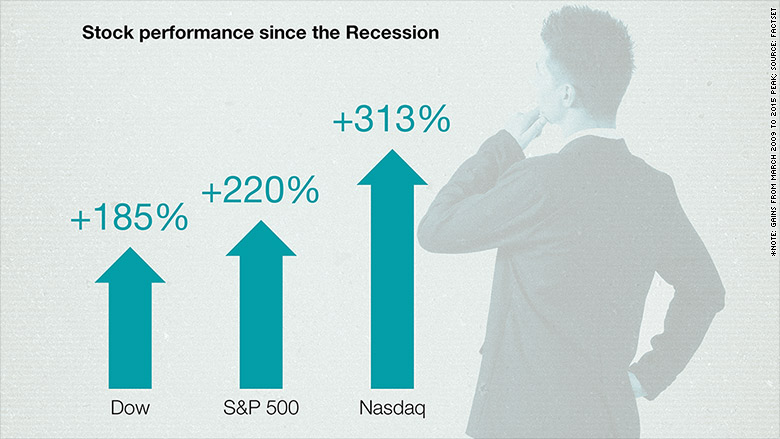
2. But you made a lot of money the past 6 years
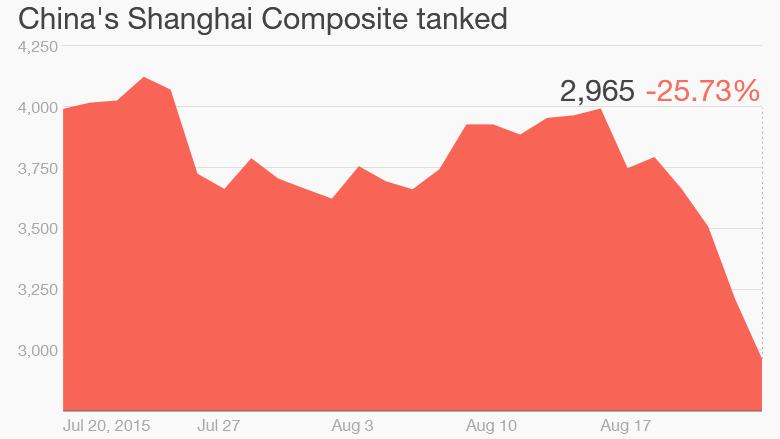
3. China is the heart of this problem
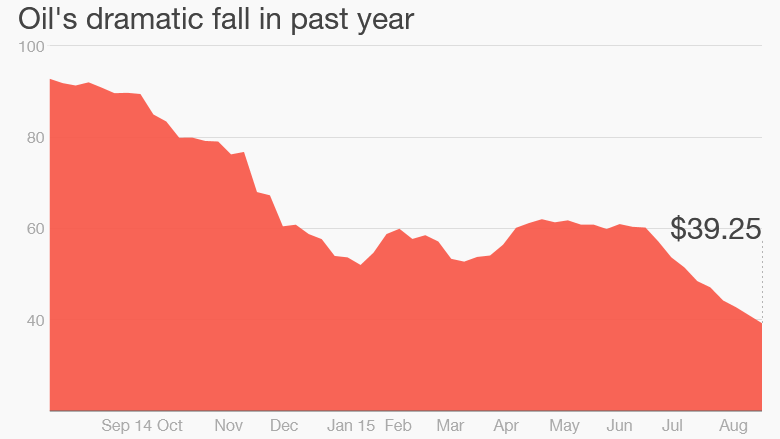
4. Oil is so cheap that some companies are hurting
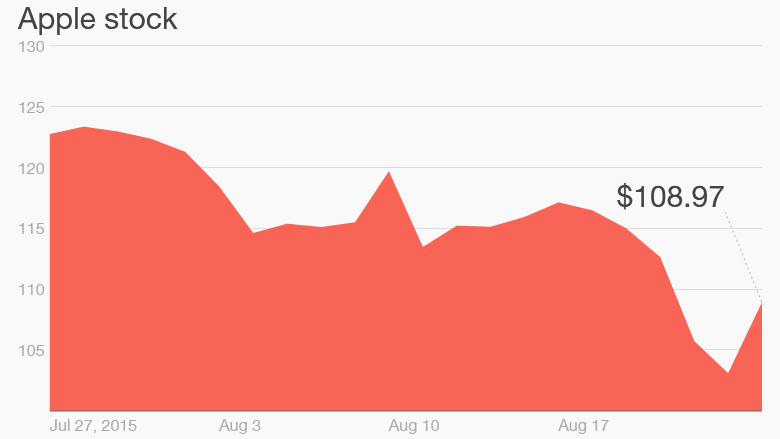
5. America’s favorite stocks like Apple are down. Maybe too much?
Source: Relax. Stocks are still up nearly 200% since 2009 – Aug. 25, 2015